In this article we will discuss about the classification of combined ratios in accounting. They are:- 1. Activity Ratios or Turnover Ratios 2. Profit Cover Ratios.
1. Activity Ratios or Turnover Ratios:
This category of ratios includes those ratios, which highlight upon the activity and operational efficiency of the business concern. The funds of creditors and owners are invested in various kinds of assets to generate sales and profits. The better the management of assets, the larger the amount of sales.
Activity ratios, also referred to as turnover ratios or asset management ratios, measure how efficiently the assets are employed by the firm. These ratios indicate the speed with which assets are being converted or turned over into sales.
The efficiency with which the assets are used would be reflected in the speed and rapidity with which assets are converted into sales. Activity ratios, thus, involve a relationship between sales and various assets and presume that there exist an appropriate balance between sales and the various assets.
ADVERTISEMENTS:
The efficiency of a firm depends, to a large extent, on the efficiency with which its assets are managed and utilised. Activity ratios are concerned with measuring the efficiency in asset management. These ratios are also called efficiency ratios.
The liquidity ratios and leverage ratios, it may be recalled, are relevant for the short-term and long-term creditors of the firm. The profitability ratios are useful in assessing the profitability of a firm to its owners as also operational efficiency of a firm.
The efficiency of a firm depends, to a large extent, on the efficiency with which its assets are managed and utilised. Thus, the activity ratios are concerned with measuring the efficiency in asset management. An activity ratio may, therefore, be defined as a test of the relationship between sales and various assets of a firm.
Every business concern formulates certain policies with regard to the operation of the business and then it acquires financial resources in the form of fixed and current assets, which are being constantly used in the operation of the concern. The success or failure of the concern depends upon proper and judicious use of these resources.
ADVERTISEMENTS:
To examine the efficiency and profitability in making use of these resources certain ratios are being used and they are collectively called as Activity ratios or Performance Ratios.
It is significant to note that these ratios are always expressed as turnover or in number of times i.e. rate of turning over or rotation. These are also known as velocities. Several activity ratios can be calculated to judge the effectiveness of asset utilisation.
The following are the important and widely used ratios:
ADVERTISEMENTS:
(a) Inventory (Stock) Turnover:
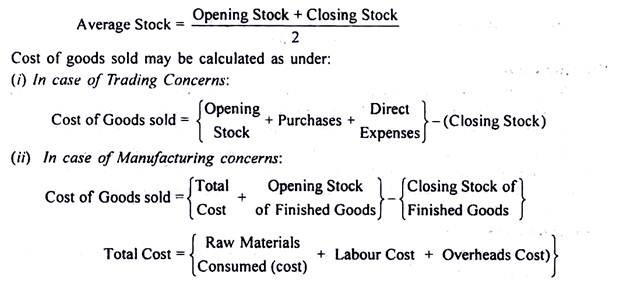
This is also known as Stock Velocity. This ratio is calculated to consider the adequacy of the quantum of capital and its justification for investing in inventory. A firm must have reasonable stock in comparison to sales. It is the ratio of cost of sales and average inventory. This ratio helps the financial manager to evaluate inventory policy. This ratio reveals the number of times finished stock is turned over during a given accounting period. This ratio is used for measuring the profitability.
The various ways in which Stock Turnover Ratios may be calculated are as follows:
ADVERTISEMENTS:
(i) Stock Turnover Ratio = Cost of Goods Sold/Average Inventory at Cost
Stock turnover ratio can be calculated by employing any one of the above formulae. The first and third formulae are considered more reasonable. The second can be used when the cost of goods sold is not known. The fourth formula is used to eliminate the effect of changing prices.
(iii) In all cases where Gross Profit is known:
ADVERTISEMENTS:
Cost of Goods Sold = Sales – Gross Profit
This ratio indicates whether investment in inventory is within proper limit or not. The quantum of stock should be sufficient to meet the demands of the business but it should not be too large to indicate unnecessary lock-up of capital in stock and danger of stock-items obsolete and getting it wasted by passing of time.
The inventory turnover ratio measures how quickly inventory is sold. It is a test of efficient inventory management. To judge whether the ratio of a firm is satisfactory or not, it should be compared over a time on the basis of trend analysis.
(b) Debtors Turnover Ratio:
ADVERTISEMENTS:
This is also called “Debtors Velocity” or “Receivable Turnover”. A firm sells goods on cash and credit basis. When the firm extends credits to its customers, book debts (Debtors or Account Receivable) are created in the firm’s account: debtors expected to be converted into cash over short period and thus included in current assets.
Debtors include the amount of Bills Receivables and Book Debts at the end of accounting period. It is the most essential that a reasonable quantitative relationship between Outstanding Receivables and Sales should always be maintained. If the firm has not been able to collect its debtors within a reasonable time, its funds are unnecessarily locked up in Receivables.
In such case short-term loans have to be arranged for paying off its current liabilities. The liquidity position of the firm depends on the quality of debtors to a great extent. Financial analysts employ two ratios to judge the quality or liquidity of debtors— Debtors Turnover and Average Collection Period.
ADVERTISEMENTS:
The question of account receivables arises only against credit sales. Debtors Turnover establishes the relationship between Net Sales of the year and Average Receivables. That is, it measures the number of times the Receivables rotate in a year in terms of sales. It shows how quickly debtors are converted into cash.
The purpose of this ratio is to measure the liquidity of the Receivables or to find out the period over which Receivables remain uncollected.
To solve the difficulty arising out of the non-availability of the information in respect of credit sales and average debtors the alternative method is to calculate the Debtors Turnover in terms of the relationship between Total Sales and Closing Balance of Debtors.
Thus:
Debtors Turnover = Total Sales/Closing Debtors
It is important to note that the first approach to the computation of the debtors turnover is superior. The effect of adopting the second approach would be to inflate the Debtors Turnover ratio.
ADVERTISEMENTS:
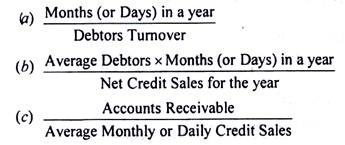
The second type of the ratio for measuring the liquidity of a firm’s debtors is the average collection period. This ratio is, in fact, interrelated with, and dependent upon, the Receivable Turnover Ratio.
Debt collection period is calculated by any of the following ratios:
Ageing Schedule:
The average collection period measures the quality of debtors in an aggregative way. We can have a detailed idea of the quality of debtors through the Ageing Schedule. The ageing schedule breaks down debtors according to the length of time for which they have been outstanding.
An example is given below:
The Ageing Schedule breaks down debtors according to length of time and quality of debtors. The Average Collection Period measures the quality of debtors in an aggregative way while Ageing Schedule very clearly spots out the slow paying debtors. From the classification, it is clear that 36% of the amounts outstanding are not more than a month old, 39% may be more than a month but less than 2 months, and so on. It also reveals that with some of the accounts the firm has serious problems of collection.
(c) Creditors Turnover Ratio:
This is also known as Accounts Payable or Creditors Velocity. A business firm usually purchases on credit goods, raw materials and services from other firms. The amount of total payables of a business concern depends upon the purchases policy of the concern, the quantity of purchases and suppliers’ credit policy. Longer the period of outstanding payable is, lesser is the problem of working capital of the firm. But when the firm does not pay off its creditors within time, it may have adverse effect on the business.
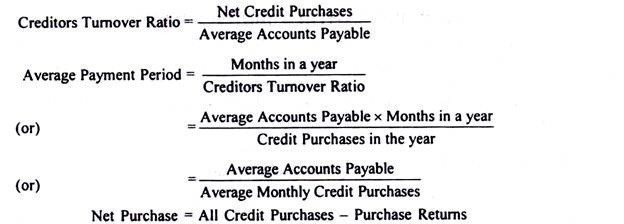
Creditors Turnover indicates the number of times the payable rotate in a year. It signifies the credit period enjoyed by the firm paying Creditors. Accounts payable include Sundry Creditors and Bills Payable. Payables Turnover shows the relationship between Net Purchases for the whole year and Total Payable (Average or Outstanding at the end of the year)
A higher ratio shows that the creditors are not paid in time. A lower ratio shows that the business is not taking the full advantage of credit period allowed by the creditors.
(d) Working Capital Turnover Ratio:
This ratio is a measure of the efficiency of the employment of the working Capital. It indicates the number of times the working capital is turned over in the course of a year. This ratio finds out the relation between cost of sales and working capital. It helps in determining the liquidity of a firm in as much as it gives the rate at which inventories are converted to sales and then to cash.
Working Capital Turnover Ratio = Cost of Sales/Net Working Capital
(Net Working Capital – Current Assets – Current Liabilities)
Higher sales in comparison to working capital means overtrading and lower sales in comparison to working capital means under-trading. A Higher Working Capital Turnover Ratio shows that there is low investment in working capital and there is more profit.
(e) Fixed Assets Turnover Ratio:
It is also known as Sales to Fixed Asset Ratio. This ratio measures the efficiency and profit earning capacity of the firm. Higher the ratio, greater is the intensive utilisation of fixed assets. Lower ratio means under-utilisation of fixed assets.
Fixed Asset Turnover Ratio = Cost of Sales/Net Fixed Assets
(Net Fixed Assets = Value of Assets – Depreciation)
(f) Capital Turnovers:
Sometimes the efficiency and effectiveness of the operations are judged by comparing the cost of sales or sales with amount of capital invested in the business and not with assets held in the business, though in both cases the same result is expected.
Capital invested in the business may be classified as Long-term and Short-term capital or as fixed capital and working capital or Owned Capital and Loaned Capital. All Capital Turnovers are calculated to study the uses of various types of capital.
2. Profit Cover Ratios:
The coverage ratios measure the relationship between what is normally available from operations of the firms and the claims of the outsiders.
We illustrate below the important coverage ratios:
(a) Interest Coverage:
This is also known as Interest Cover Ratio or Debt Service Ratio. This ratio measures the debt servicing capacity of a firm in so far as fixed interest on long term loan is concerned. That is, the relationship between Earnings before Interest and Tax (EBIT) and fixed interest charges. It is expressed in percentage or number of times.
Interest Coverage = EBIT/Fixed Interest Charges
This ratio shows how many times the interest charges are covered by EBIT out of which they will be paid. The coverage ratio may be interpreted with reference to its degree. Higher the ratio, better is the position of long-term creditors. It also highlights the ability of the firm to raise additional funds in future.
( b) Dividend Coverage:
It measures the ability of a firm to pay dividend on preference shares which carry a stated rate of return. The ratio, like the Interest Coverage Ratio, reveals the safety margin available to preference shareholders. Higher the coverage, better is the position. This ratio is the ratio, expressed in number of times, of net profits after taxes.
Thus:
Dividend Coverage = Net Profit after Tax and Interest/Preference Dividend
(c) Equity Shareholders Coverage:
It indicates the number of times the Equity dividends are covered by the Net Profit, i.e. Net Profit after charging Interest, Tax and Preference Dividend. The higher the coverage, the better will be the financial strength and the fairer the return for the shareholder since maintenance of dividend is assured.
Equity Shareholders Coverage
Net Profit after Interest, Tax and Preference Dividend/Equity Dividend.


