Cost-Volume-Profit Analysis [with Formula, Assumptions and Examples]!
Cost-volume-profit (CVP) analysis is a technique that managers use for short-term profit planning. Fixed costs, which in total remain fixed within a relevant range and within a short period in which prices are not expected to change, do not change with change in the activity level and therefore may be considered as given for the plan period.
E.g., if the fixed costs for the budget period (year 2008) are estimated at CU 5 million, we may assume that during the budget period 2008, fixed costs will remain at CU 5 million irrespective of actual quantities produced and sold.
In most situations, a large part of fixed costs are capacity-related costs and balance represents cost of resources already committed to achieve the planned production and sales. We define variable costs that in total vary in direct proportion to the change in the volume of production and sales.
ADVERTISEMENTS:
In other words, variable costs per unit represent cost of resources consumed to produce and sale one unit of the product or service. E.g., if variable costs per unit for the budget period are estimated at CU 60 per unit and the firm is expected to produced and sold 30,000 units, actual variable costs would be CU 1,800,000.
If, the sales revenue for these 30,000 items is estimated at CU 7.5 million, we may say the product is expected to contribute (CU 7.5 million to CU 1.8 million) or CU 5.7 million towards fixed costs and operating profit. The operating profit for the year 2008 is expected to be (CU 5.7 million to CU 5 million), i.e., CU 0.7 million.
Cost-Volume-Profit Analysis [with Formula, Assumptions and Examples]
This relationship can be written in an equation form as follows:
Formula
S – V = C = F + P
ADVERTISEMENTS:
Where,
S = Total sales revenue
V = Total variable cost
C = Total contribution
ADVERTISEMENTS:
F = Total fixed cost
P = Operating profit
We may take the numbers from our example above, and may write:
CU 7.5 million – CU 1.8 million = CU 5.7 million = CU 5 million + CU 0.7 million
ADVERTISEMENTS:
Total variable cost is the total of variable production costs, and variable selling and distribution expenses. The relationship presented above is valid only if we assume that whatever will be produced during the plan period will be sold in that period and there will be no change in the inventory of finished goods or work-in-progress, and we shall not carry forward a part of fixed costs to the next period.
ASSUMPTIONS
ASSUMPTIONS: If we assume that the selling price per unit and variable cost per unit will be uniform for all the units that we plan to produce and sell during the plan period, we may present the relationship as follows:
Q × ( s – v ) = F + P
Where,
ADVERTISEMENTS:
Q = Quantity expected to be produced and sold
S = Selling price per unit
v = Variable cost per unit
F = Total fixed cost
ADVERTISEMENTS:
P = Operating profit
If we define contribution per unit as selling price per unit minus the variable cost per unit, we may replace (s – v) in the above equation by c (a symbol that we may use for contribution per unit) and write:
Q × c = F + P
or
ADVERTISEMENTS:
Q × c – F = P
As we have assumed that s and v will be same for all the units that we plan to produce and sell, c will be same for all the units.
If we assume that in our example above, we estimated our sales revenue for the year 2008 at CU 7.5 million by estimation that we shall sell all the 30,000 units at the uniform price of CU 250 per unit, our estimated contribution per unit will be (CU 250 – CU 60), i.e., CU 190 per unit.
Therefore, we can write:
30,000 × CU 190 – CU 5,000,000 = CU 70,000
If we expect s and c to be constant for all the units that we shall produce and sell during the plan period, then c/s will be constant and C/S will be equal to c/s. In our example, c/s ratio is CU 190/CU 250 = 0.76. Similarly, C/S ratio is CU 5.7 million/ CU 7.5 million = 0.76.
ADVERTISEMENTS:
The c/s ratio is often referred to as profit/volume (P/V) ratio. We shall use c/s ratio or C/S ratio throughout this text to represent contribution as a percentage of sales. Once we estimate the selling price per unit, variable cost per unit, c/s ratio, and fixed cost for the period, we can plan our profit for the period.
Let us summarise our assumptions which are the following:
(a) Fixed and variable cost patterns can be established with reasonable accuracy.
(b) Total fixed costs and variable cost per unit will not change during the period under consideration.
(c) Selling price will remain constant at all sales volumes.
(d) Factor price per unit (e.g. material prices, wage rates) will remain constant at all sales volumes.
(e) Efficiency and productivity will remain unchanged during the period under consideration.
(f) Output is the only relevant factor affecting costs and revenue.
(g) The volume of production will be equal to the volume of sales i.e., accretion/decoration to inventory level will be insignificant during the period.
Breakeven Point:
Breakeven point (BEP) is the point at which the operating income is zero. In other words, BEP is the sales level at which total contribution is equal to fixed cost or total revenue is equal to total cost.
We may continue with the example above to illustrate the calculation of BEP. In our example, we estimated the selling price per unit at CU 250, variable cost per unit at CU 60, contribution per unit at CU 190, and fixed cost at CU 5 million. The c/s ratio is 0.76.
The BEP is (CU 5,000,000/CU 190) or 26,316 units. We may calculate BEP in terms of sales value by using the c/s ratio. The BEP in terms of sale value is (CU 5,000,000/0.76) or CU 6,578,947.
We may check this calculation as follows:
BEP in terms of sales value = BEP in terms of numbers × Selling price per unit
= 26,316 × CU 250
= CU 6,579,000
The small difference is due to approximation.
Margin of Safety:
Margin of safety is indicated by how much sales may decrease before an operating loss occurs. It is the difference between the planned sales and the breakeven sales. It is usually expressed as a percentage of planned sales. In our example, the planned sale is 30,000 units.
Therefore, the margin of safety is (30,000 – 26,316) or 3,684 units, which is 12% of planned sales. We may calculate the margin of safety from sales value. In this example, margin of safety in terms of sales value is (CU 7.5 million – CU 6.58 million) or 0.92 million, which is 12% of planned sales.
Breakeven Point in a Multi-Product Situation:
We may calculate the BEP in a multi-product situation only with the assumption that a predetermined product mix will be maintained throughout the period and proportion of sales of different products in the total sales volume will not change. We have to calculate the weighted average c/s ratio.
Examples
Breakeven Charts:
A typical breakeven chart graphically presents the BEP. The horizontal axis shows the unit of output and the vertical axis shows the cost and revenue in terms of value.
The following data is used to draw the breakeven chart presented in Exhibit 7.1:
The conventional breakeven chart is presented in Exhibit 7.1. The breakeven chart is drawn by plotting total revenue, fixed cost, and total cost on the F-axis and out put on the X-axis. The point of intersection between the total revenue line and the total cost line is the BEP. The BEP is at 40,000 units. If we reduce the selling price to CU 18, the BEP will shift to 50,000 units.
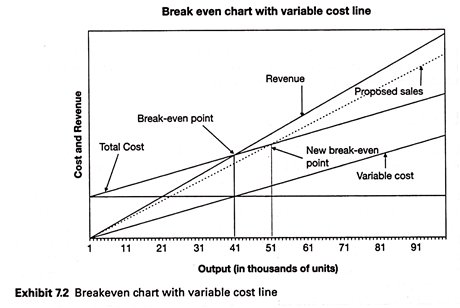
Exhibit 7.2 presents the breakeven chart with variable cost line. In the conventional breakeven chart, fixed cost and total cost lines are presented, while in the presentation at Exhibit 7.2, fixed cost line is not presented; instead of the fixed cost line, the variable cost line is presented.
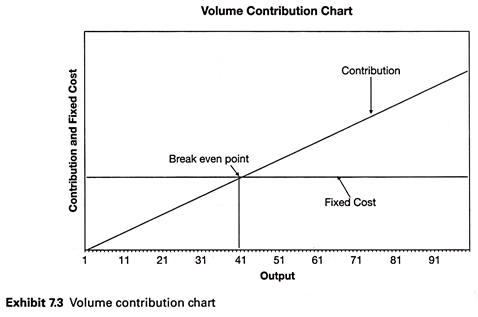
Exhibit 7.3 presents the volume contribution chart. In this chart, the fixed cost and the total contribution at different output levels are plotted. The point of intersection between the contribution line and the fixed cost line is the BEP.
Sensitivity Analysis:
Sensitivity analysis or ‘what if’ analysis can be done using the relationship between selling price, variable cost, and contribution; and the relationship between contribution, fixed cost, and operating profit. We can estimate the effect of change in selling price, variable cost, or fixed cost on the operating profit. E.g., a company, which produces a single product, estimates that during the year 2008 it will produce 80,000 units. It estimates the selling price at CU 20, variable cost at CU 10, and fixed cost at CU 500,000.
Accordingly, the breakeven sale for the year 2008 is estimated at 50,000 units and the operating profit is estimated at CU 300,000. Managers may like to understand the impact of change in the selling price by 10%. If the selling price reduces by 10%, the contribution will reduce by CU 2 or by 20% and the breakeven sales will go up to 62,500 units.
The operating profit will come down to CU 140,000. If, the variable cost increases by 10%, contribution will reduce by CU 1 or by 10%. Consequently, BEP will go up to 55,556 units, and operating profit will reduce to CU 220,000. If, the fixed cost increases by 10%, the BEP will go up to 55,000 units and operating profit will reduce to CU 250,000. In this example, the operating profit is most sensitive to the change in the selling price.


